The results
The numbers do not lie.
Two clients. One playbook. Real analytics, straight off the app. No bought followers. Just content shot to travel, and the reach to prove it.
From just the two campaigns below. Here are the receipts.
Case 01, Client A
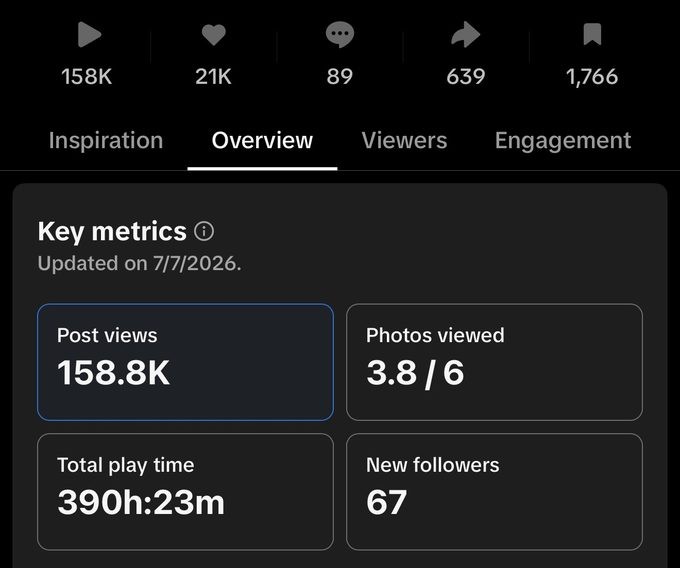
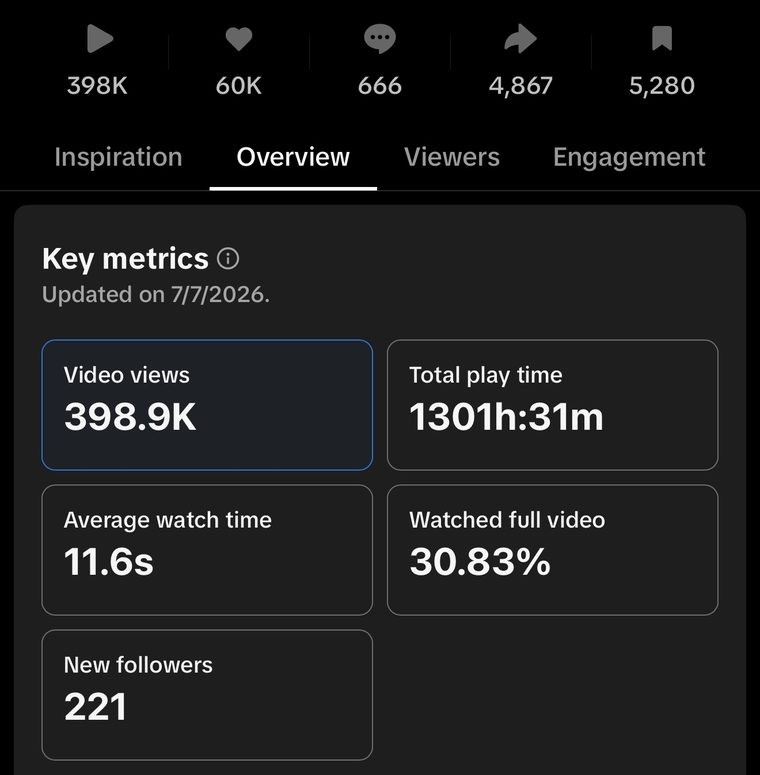
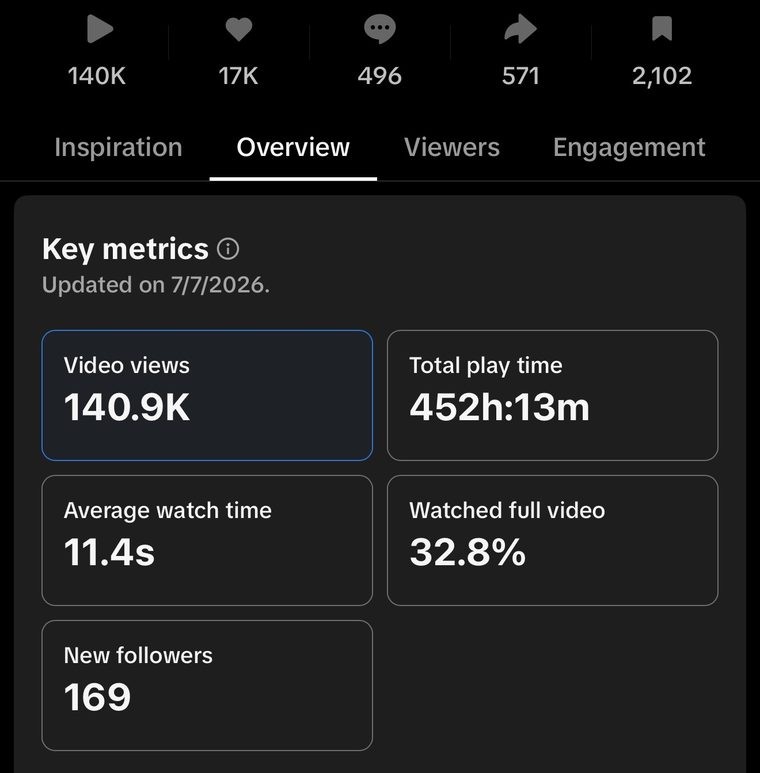
Views across 3 posts
Over 2,144 hours of total watch time. That is 89 straight days of people watching this content.
- Saves 1,766
- Shares 639
- Watch time 390h
- Watched full 30.8%
- Shares 4,867
- New follows 221
- Watched full 32.8%
- Saves 2,102
- New follows 169
The story in the stats: people did not just glance. 9,148 saved it to come back to, and 6,077 sent it to a friend. On the breakout post, over 30% watched the whole thing. That is content built to hold attention.
Straight from the app
Case 02, Client B
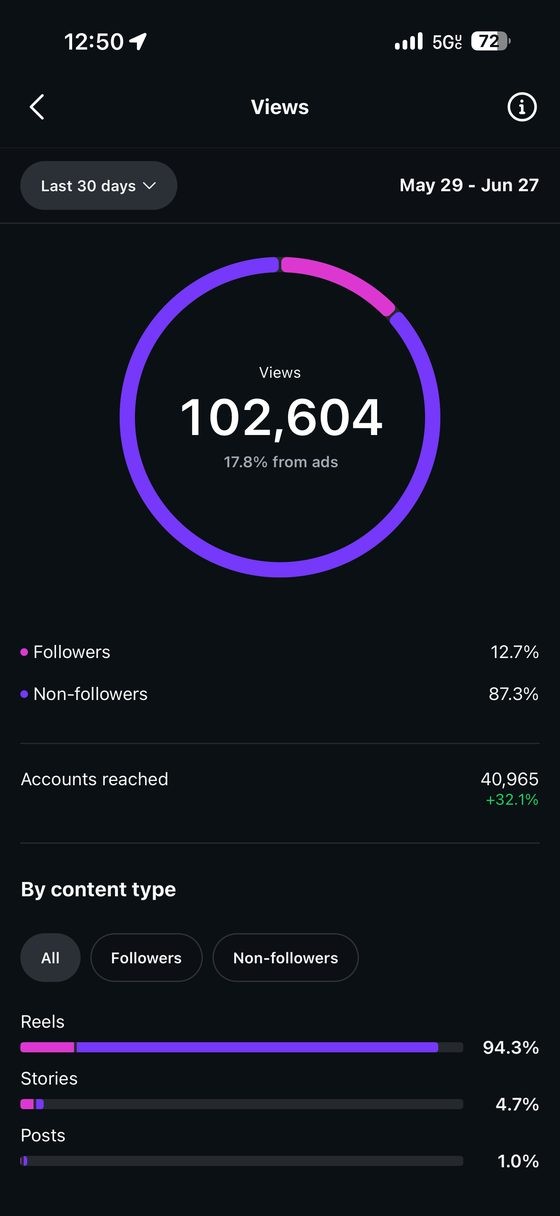
Views in one month
40,965 accounts reached, up 32.1% over the month before.
This is the stat business owners feel instantly: 87.3% of viewers were not followers yet. Nearly nine in ten people who saw this content had never heard of the business. New faces, not the same regulars. And 82% of that reach was earned organically, not bought.
From reach to revenue
How a view becomes a customer.
People nearby watch
Short video reaches people in your area who have never heard of you.
They see you again
Steady posting and ads keep you in front of them until your name sticks.
They visit or call
When they are hungry or need the job done, you are the one they think of.
If only 1 in every 1,000 viewers becomes a customer, 100,000 views is 100 new customers. Your real number depends on your business, your offer and your follow-through.
Clients
A few of our clients.






Figures pulled directly from Instagram and TikTok analytics across two separate client accounts. Results vary by business, market and effort.
In their words
What our clients say.
See your price in about a minute.
Pick your videos and services, choose how you want to pay, and the estimator does the math. Bundle discounts are built in.
Open the estimator